Analyzing Elevator Performance Data: KPIs Every Facility Manager Should Track
In today’s data-driven world, building operations have evolved far beyond routine checklists and manual logs. Elevators one of the most vital components of any modern facility are now monitored with precision through data analytics, smart sensors, and real-time dashboards.
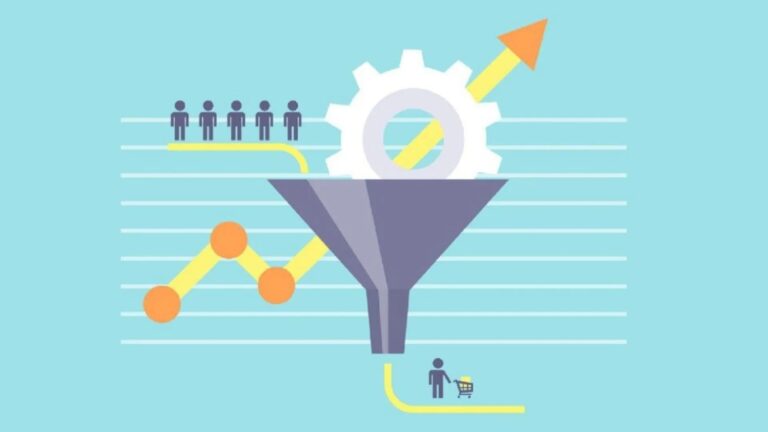
Yet, while many buildings collect elevator data, few know how to interpret it effectively. Facility managers who understand what to measure and why are better equipped to enhance performance, reduce costs, and improve passenger experience.
This article breaks down the essential key performance indicators (KPIs) for elevator performance analysis, why they matter, and how smart tools like Elevator App help facility teams stay proactive instead of reactive.
Why Elevator Performance Data Matters
Every elevator tells a story how efficiently it moves, how often it breaks down, how passengers use it, and even how much energy it consumes. Without reliable data, those stories remain hidden, leading to guesswork in decision-making.
By analyzing elevator data, facility managers can:
- Detect early signs of mechanical issues before breakdowns occur.
- Reduce energy costs through optimized performance.
- Improve passenger satisfaction by minimizing waiting and travel times.
- Maintain compliance with local safety codes and inspection schedules.
- Benchmark performance across multiple buildings or service providers.
In short, data transforms elevator maintenance from reactive fixes to predictive insights saving both time and money.
Downtime and Uptime Ratio
Why It Matters
Downtime is the most critical metric in elevator operations. It directly affects tenant satisfaction, accessibility, and building reputation.
Even a few hours of unplanned elevator downtime in commercial buildings can lead to lost productivity, frustrated tenants, and negative reviews.
How to Measure
The uptime ratio is calculated as:
Uptime (%) = (Total Operational Time ÷ Total Time) × 100
For high-performing buildings, uptime should remain above 99.5%. Any lower figure signals maintenance inefficiencies or equipment age issues.
How ElevatorApp Helps
ElevatorApp’s real-time monitoring system automatically tracks uptime and downtime events. Its intuitive dashboard highlights recurring downtime patterns, helping facility managers identify whether the root cause is mechanical, electrical, or procedural.
Mean Time Between Failures (MTBF)
Why It Matters
MTBF measures the average time an elevator operates before experiencing a failure. A higher MTBF indicates better reliability and reduced maintenance costs.
Formula
MTBF = Total Operating Time ÷ Number of Failures
For example, if an elevator runs for 1,000 hours before its next malfunction, the MTBF is 1,000 hours — a strong indicator of stability.
Pro Tip
Set MTBF targets based on elevator type:
- Hydraulic elevators: 500–800 hours
- Traction elevators: 1,000–1,500 hours
- High-rise elevators: 2,000+ hours
ElevatorApp allows you to visualize MTBF trends per car, per building, or across your entire property portfolio.
Mean Time to Repair (MTTR)
Why It Matters
While failures can’t always be avoided, the speed of repair defines operational efficiency. MTTR measures how long it takes to restore an elevator to service after a failure.
Formula
MTTR = Total Downtime ÷ Number of Repairs
A high MTTR may indicate inadequate technician response times, poor spare parts availability, or communication delays between maintenance teams.
How ElevatorApp Enhances MTTR
With ElevatorApp’s maintenance logs and automatic fault alerts, technicians can diagnose issues faster often before arriving on-site. Push notifications ensure no downtime goes unnoticed, reducing repair response times significantly.
Ride Quality and Passenger Comfort
Why It Matters
Passengers may not understand technical terms like “controller lag” or “brake chatter,” but they feel when a ride is rough, noisy, or slow. Ride quality directly impacts how tenants perceive building quality.
Key Indicators
- Acceleration and deceleration smoothness
- Door opening/closing speed consistency
- Cabin vibration or noise levels
- Leveling accuracy (alignment with floor thresholds)
Using Data to Improve Comfort
ElevatorApp’s analytics track these micro-performance metrics via integrated sensors. Facility managers can benchmark ride quality over time and identify when wear and tear begin to affect passenger comfort before complaints arise.
Energy Consumption and Efficiency
Why It Matters
Elevators account for 2–10% of a commercial building’s total energy use. Inefficient systems waste both energy and money.
Key Energy KPIs
- kWh per trip: How much energy each elevator consumes per operation.
- Idle energy draw: Energy used when the elevator is not in motion.
- Regenerative feedback efficiency: How effectively the system recovers energy during descent.
How ElevatorApp Helps
By integrating with smart meters, ElevatorApp visualizes energy consumption in real time. Facility teams can identify excessive usage, compare energy profiles across elevators, and plan modernization efforts such as adding regenerative drives or LED lighting.
Passenger Wait Time
Why It Matters
Nothing frustrates tenants more than waiting too long for an elevator. Long wait times indicate scheduling inefficiencies or outdated group control logic.
How to Measure
Measure average wait time (in seconds) across different hours of the day.
An optimal elevator system typically keeps wait times under:
- 30 seconds in offices
- 40 seconds in residential buildings
Optimize with Data
ElevatorApp collects timestamp data from every call button press and car arrival. Its analytics help managers adjust service parameters, reduce bottlenecks, and schedule peak-time optimization.
Trip Count and Load Analysis
Why It Matters
Understanding usage patterns prevents overload and wear imbalance across elevators. Tracking trip counts helps identify which elevators handle more demand and may need earlier maintenance.
Data Insights to Track
- Trips per day/week/month
- Average load weight per trip
- Peak-hour traffic volume
ElevatorApp visualizes this data through heatmaps, showing which cars face the heaviest usage. This helps managers balance operations or rotate elevators strategically to even out wear.
Fault Frequency and Alarm Trends
Why It Matters
Frequent alarms or faults even minor ones are early warnings of bigger problems. Tracking their frequency allows for predictive maintenance.
Best Practice
Categorize faults by type:
- Door issues (most common)
- Controller or relay faults
- Safety circuit trips
- Power or voltage errors
ElevatorApp’s built-in fault analytics automatically categorize and time-stamp every alert, giving managers a clear pattern of recurring issues.
Maintenance Compliance Rate
Why It Matters
Most jurisdictions require regular elevator inspections and maintenance per safety codes such as ASME A17.1 / CSA B44. Missing even one inspection can result in fines or shutdowns.
How to Track
Measure the percentage of scheduled maintenance tasks completed on time.
Maintenance Compliance Rate = (Completed Tasks ÷ Scheduled Tasks) × 100
ElevatorApp’s compliance dashboard helps managers maintain full inspection logs, upload reports, and receive automated reminders ensuring zero missed deadlines.
Cost per Operating Hour
Why It Matters
Ultimately, all metrics tie back to financial efficiency. This KPI shows how much each elevator costs to operate and maintain over time, factoring in energy, parts, and service expenses.
How to Calculate
Cost per Operating Hour = (Total Maintenance + Energy + Repairs) ÷ Total Hours of Operation
With ElevatorApp, facility managers can merge operational and financial data, creating cost efficiency reports for budget planning and performance review.
How Elevator Data Drives Smart Decision-Making
Once these KPIs are tracked consistently, they reveal patterns that guide smarter decisions:
- Predictive Maintenance: Anticipate component failure before it happens.
- Budget Optimization: Allocate funds to the most cost-effective upgrades.
- Performance Benchmarking: Compare multiple properties under one portfolio.
- Tenant Satisfaction: Proactively reduce complaints and service calls.
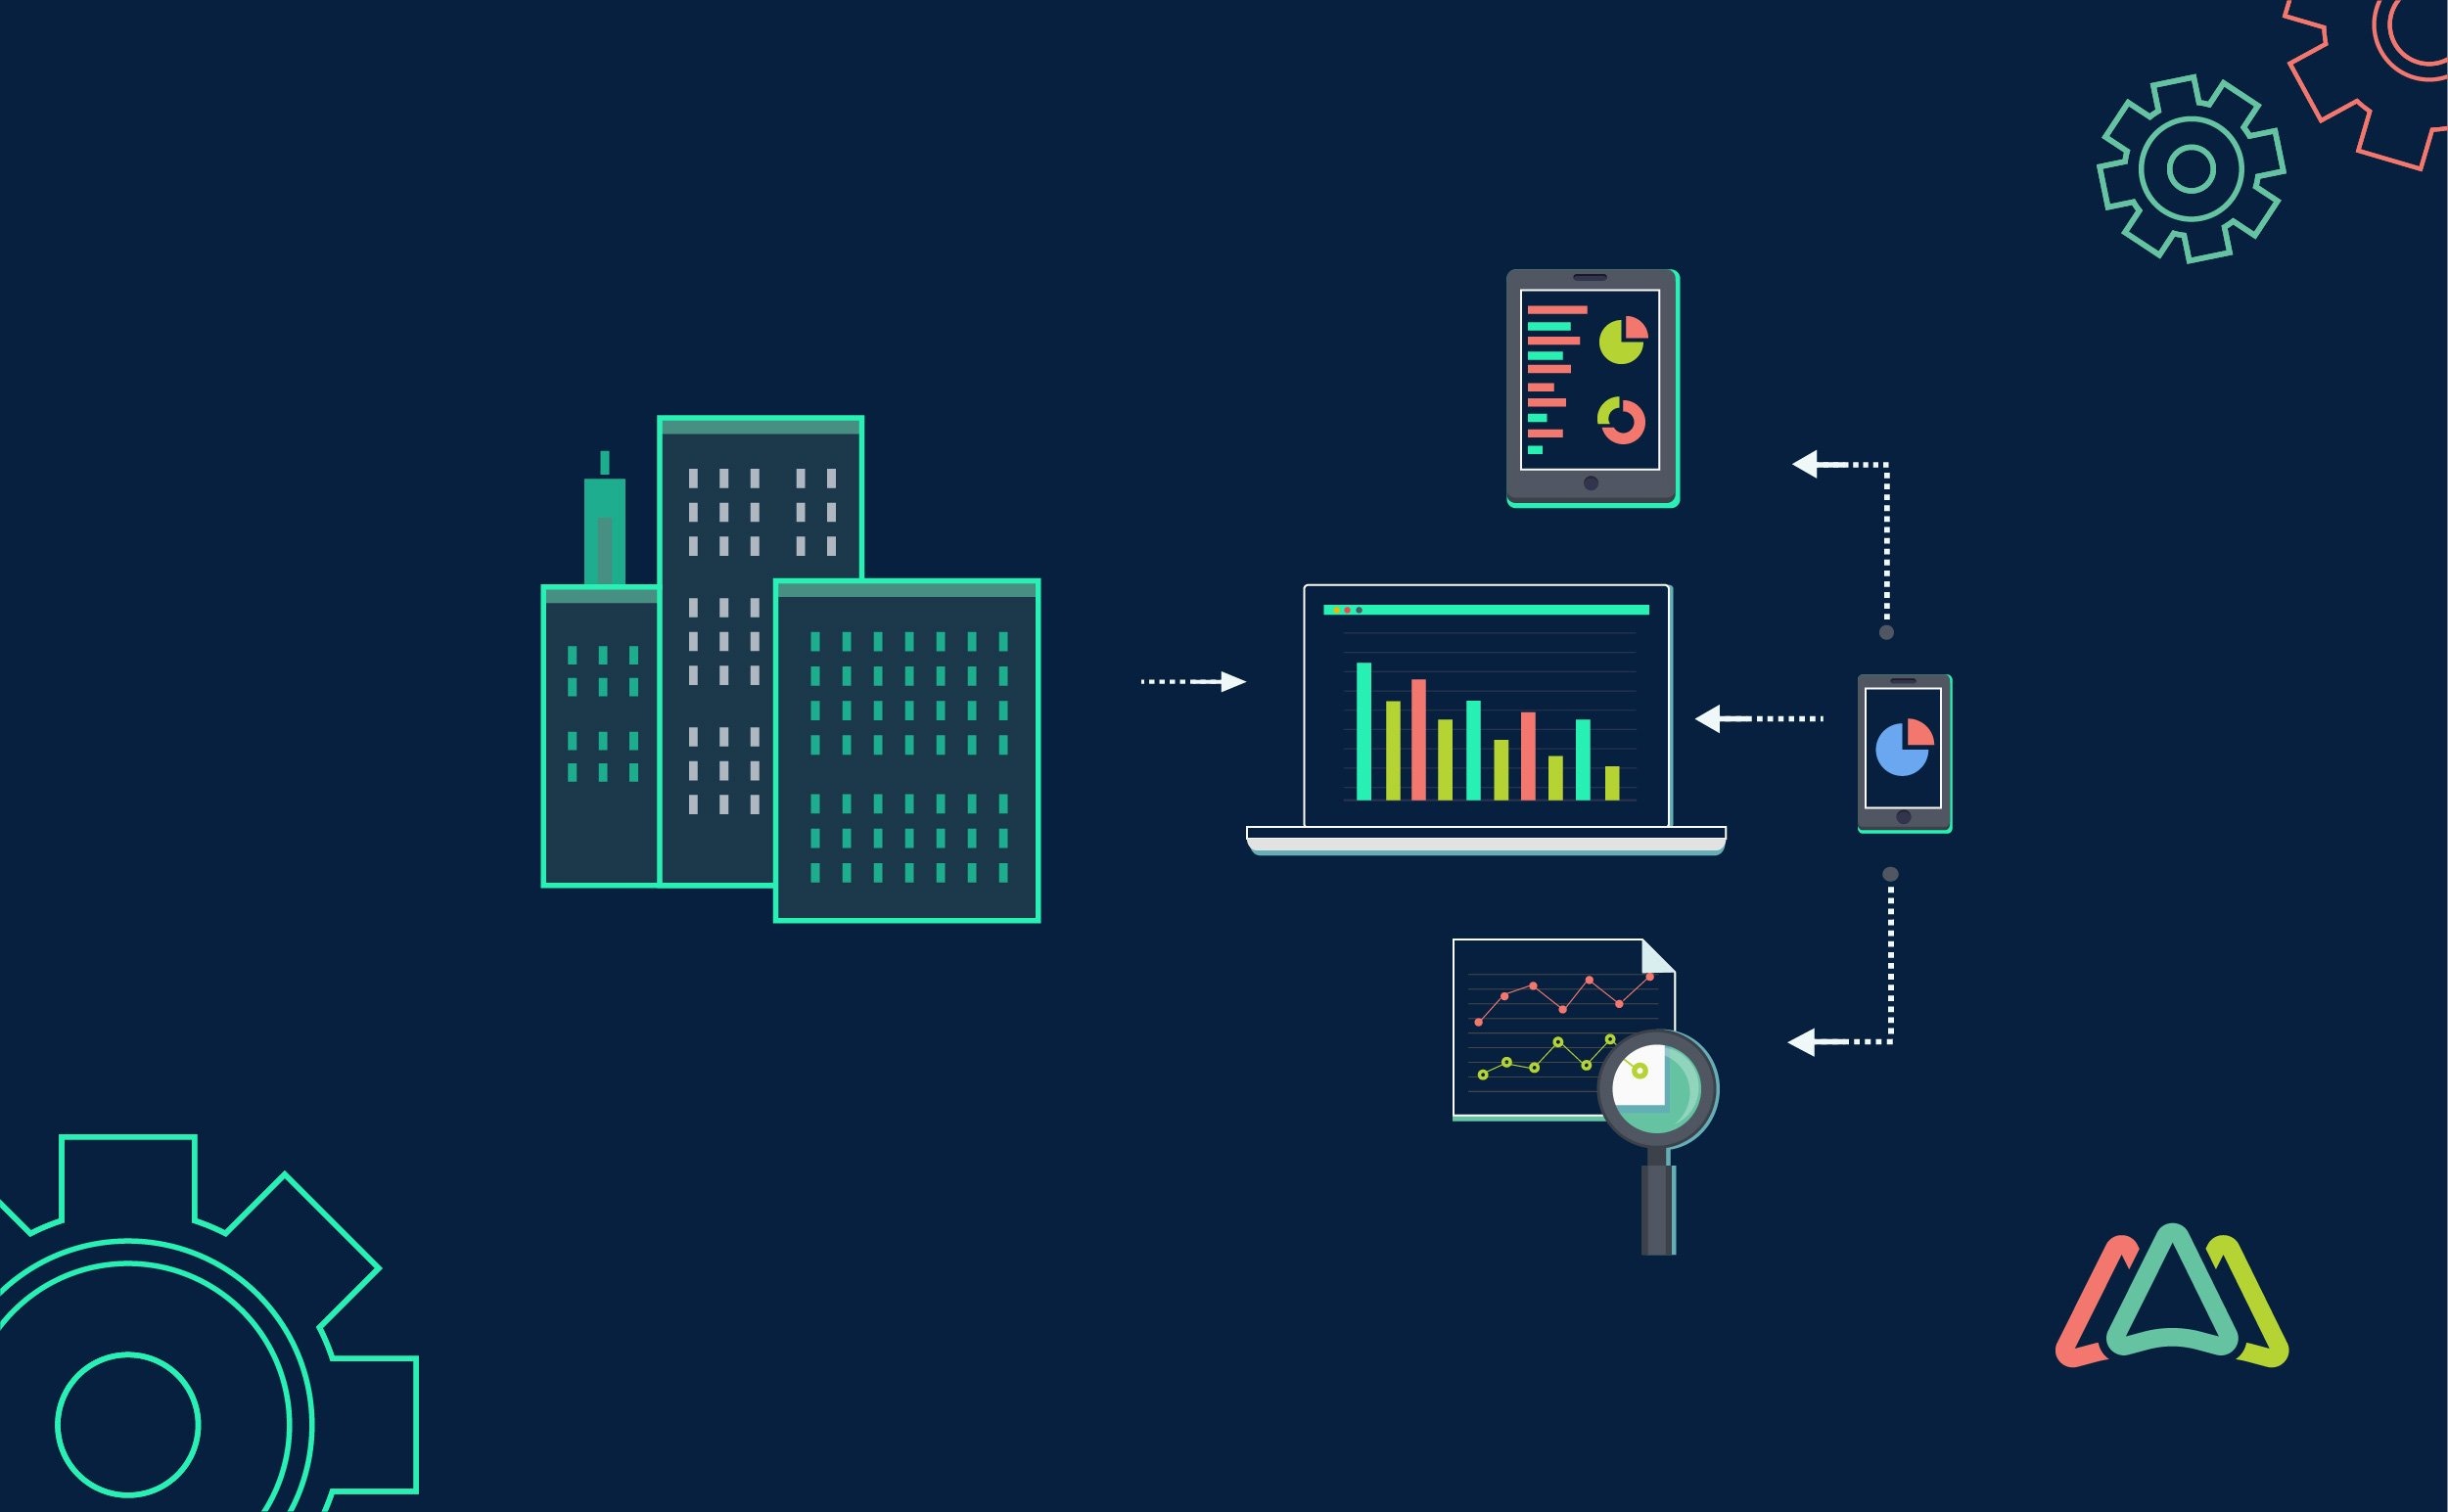
With a platform like ElevatorApp, data visualization simplifies these complex insights into easy-to-read dashboards, giving managers control over every elevator in their building from anywhere.
Integrating Elevator Data into Facility Management Systems
The best elevator analytics tools don’t operate in isolation. ElevatorApp integrates seamlessly with Building Management Systems (BMS), allowing unified monitoring of HVAC, lighting, and vertical transport under one platform.
This integration enables:
- Real-time alerts across systems
- Centralized reporting
- Cross-functional maintenance scheduling
- Improved sustainability tracking
For large properties or multi-building portfolios, this unified view is essential for consistent quality and cost control.
From Data to Action: Building an Elevator KPI Strategy
To make the most of your elevator data:
- Define clear performance goals.
Start by deciding what “good performance” means for your building uptime, energy savings, passenger experience, etc. - Standardize your KPIs.
Use the same metrics across all elevators to maintain accurate comparisons. - Automate data collection.
Manual logs are outdated. Use ElevatorApp to automate fault tracking, ride analysis, and compliance records. - Analyze trends monthly.
Regular reviews help spot declines in performance early before they become costly. - Share reports transparently.
Provide building owners, tenants, and service providers with clear, data-backed performance reports.
The Future of Elevator Performance Analytics
The next generation of elevator management lies in AI-driven predictive maintenance. Machine learning algorithms can now analyze sensor data from ElevatorApp to predict failures days or weeks in advance.
This predictive capability not only prevents downtime but also optimizes part replacement schedules and technician allocation. The result? Fewer emergencies, lower costs, and a safer passenger experience.
As sustainability becomes a core priority, expect data analytics to also play a major role in energy optimization, helping buildings achieve LEED or BREEAM certifications by minimizing elevator energy waste.
Monitoring elevator performance isn’t just about ticking maintenance boxes it’s about unlocking insights that drive efficiency, safety, and tenant satisfaction.
By focusing on the right KPIs uptime, MTBF, MTTR, energy consumption, and more facility managers can make informed decisions that reduce costs and enhance reliability.
With innovative platforms like ElevatorApp, facility teams can transform raw data into actionable intelligence, ensuring elevators run smoother, smarter, and more sustainably than ever before.